

Know the health of every asset before it fails.
One reporting system for any asset health inspection or condition-monitoring program — vibration, thermography, sound & ultrasonic, oil analysis, and visual inspections. RelOnion turns readings and findings into reports, work orders, and a health timeline you can follow over time.
Any asset health or condition-monitoring report
Pick a report type, capture findings, and rate asset health — for any inspection method or sensor system you run.
Vibration
Vibration analysis — axial & radial exceedance, 1X RPM, FFT spectra.
Thermography
Thermal imaging — hotspots, temperature gradients, general overheating.
Sound & Ultrasonic
Acoustic and ultrasonic testing — bearing faults, air and steam leaks.
Oil Analysis
Lubricant condition — wear particles, contamination, and lab results.
Visual Inspection
Look, listen, feel — visible wear, corrosion, leaks, and damage.
Any other type
Add custom report types for any inspection or sensor system you run.
From raw data to a report you can act on
Create a health report, pick the report type, and capture symptoms, diagnostics, analysis, and recommended actions — all linked back to the asset, its sensors, and its maintenance history.

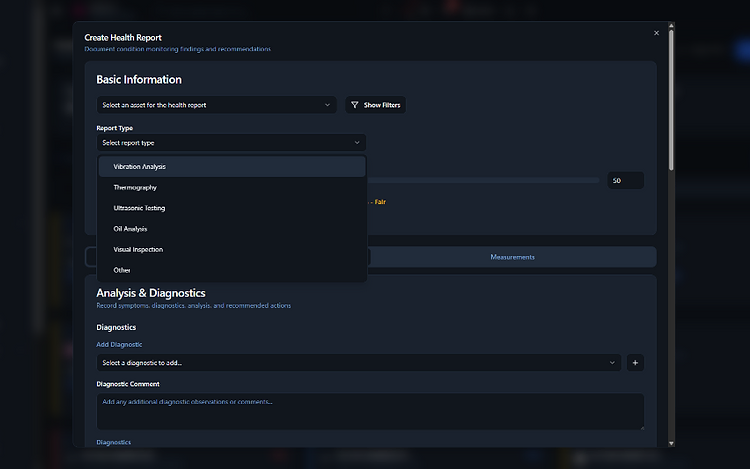
The asset health report, end to end
From capturing a reading to tracking failures — every step of the condition-monitoring report lives in one place.

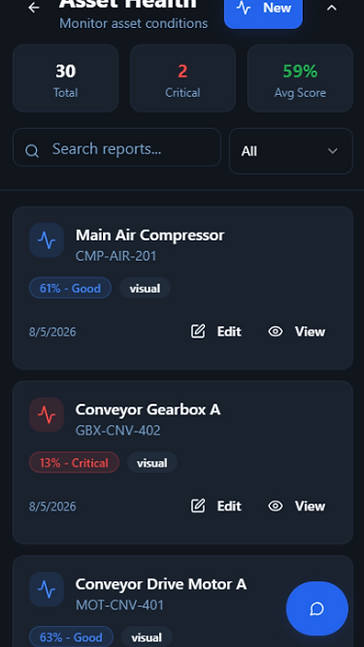
Asset Health overview
Every asset's health score in one list — total, critical, and average score up front, with quick edit and view actions.

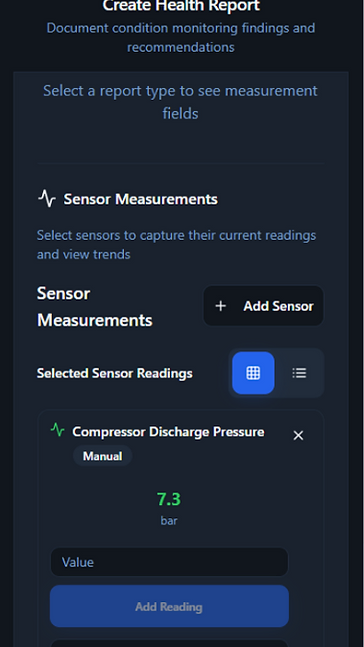
Create report — sensors
Pick sensors to capture their current readings and trends straight into the health report.

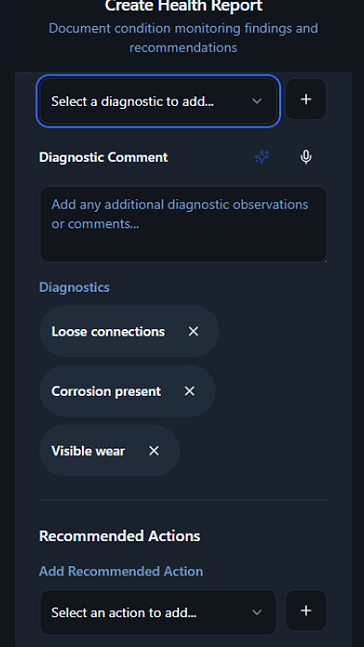
Create report — diagnostics
Log diagnostics, add comments, and list recommended actions in one structured flow — every finding captured against the asset.

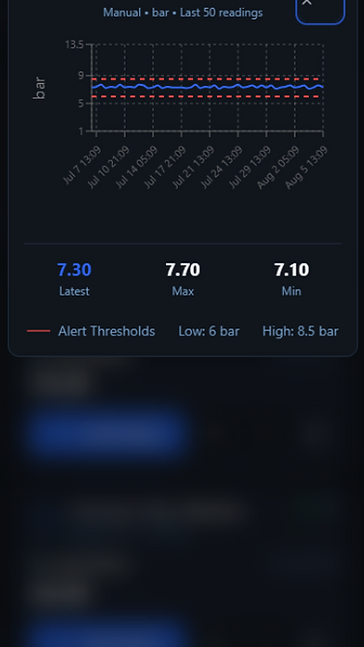
Sensor trend chart
Visualise the last 50 readings against alert thresholds — latest, max, and min values with dashed high/low alarm lines.

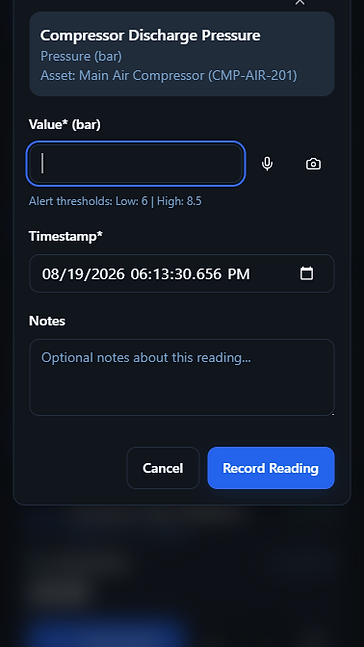
Record sensor reading
Log a manual reading with value, timestamp, and notes — alarm thresholds shown inline so out-of-range values are flagged instantly.

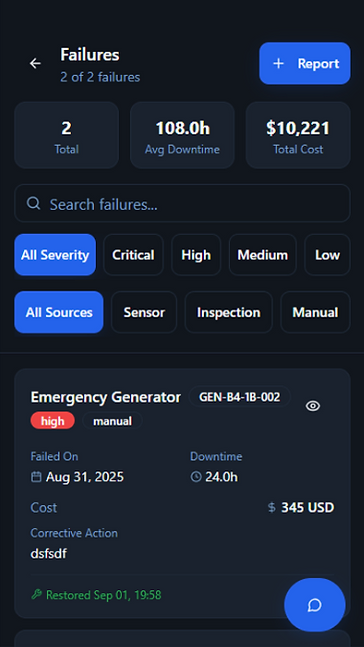
Failures dashboard
Track failure events with downtime hours and cost per asset, filtered by severity and source — sensor, inspection, or manual.

Generate work orders from the report
Turn a health report's diagnostics and maintenance recommendations into a tracked work order — with the full diagnostic context carried through, so the technician knows exactly why and what.
- Generate a work order straight from a health report's diagnostics
- Maintenance recommendations carry over into the task automatically
- The work order keeps the full diagnostic context attached — no lost detail
- Close the loop: inspection → diagnosis → recommendation → scheduled work
Follow the asset health timeline
Track each asset's health score over time, with failure diagnostics, recommended actions, performed actions, and completed maintenance tasks overlaid on the same timeline — so you see the full story of what happened, what was done, and what still needs attention.
- Follow each asset's health score over time — 12-month trends and beyond
- Health timeline overlaid with failure diagnostics and recommended actions
- See performed actions and completed maintenance tasks on the same axis
- Understand what intervention worked and what still needs attention

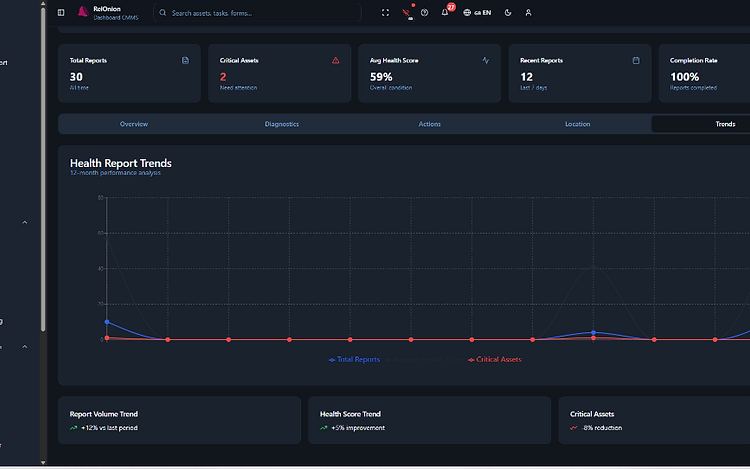
The numbers behind your reliability
Total reports, critical assets, average health score, completion rate — plus the analytics that connect diagnosis to action.

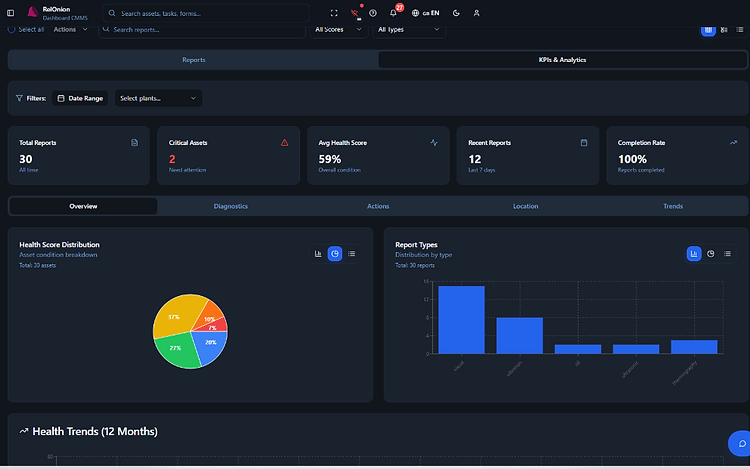
Health score distribution & report types
Asset condition breakdown alongside report-type volume — Visual, Vibration, Oil, Ultrasonic, Thermography.

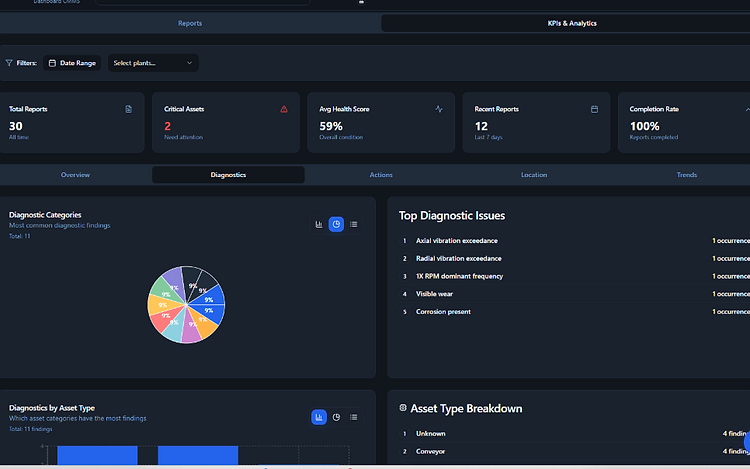
Diagnostics
Diagnostic categories as a pie chart, top diagnostic issues with occurrence counts, and findings broken down by asset type.

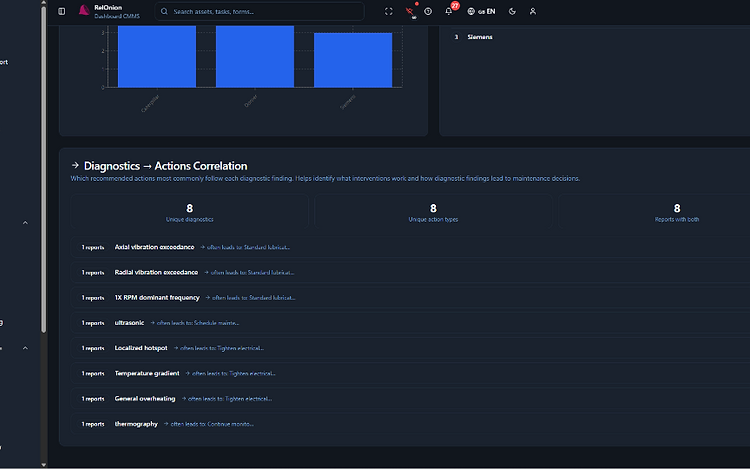
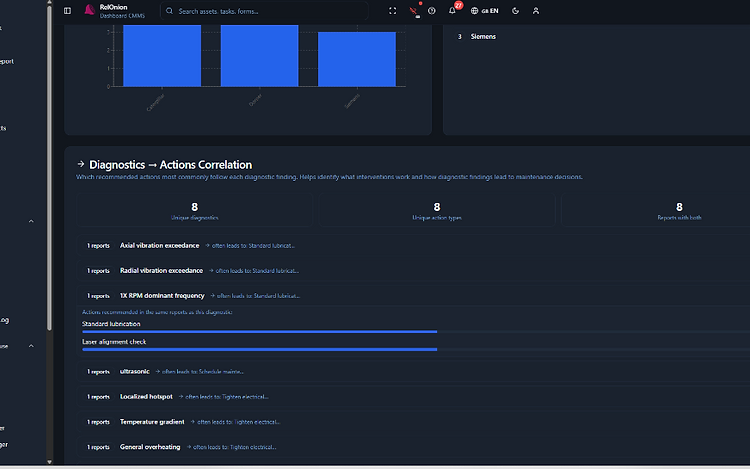
Diagnostics → Actions correlation
Which recommended actions most commonly follow each diagnostic finding — see what interventions work.

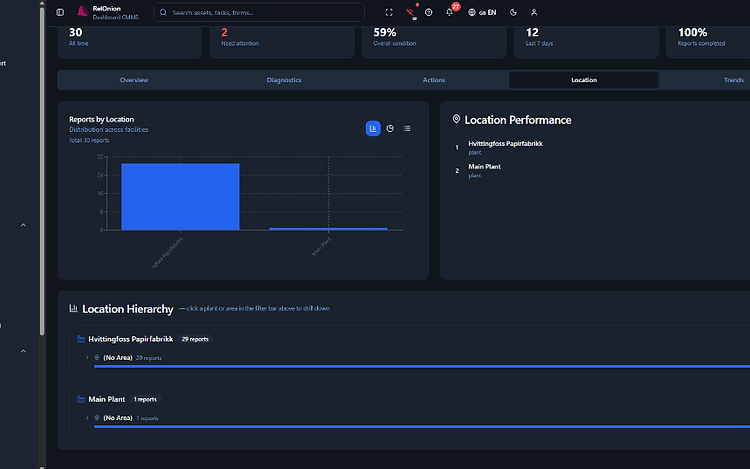
Reports by location
Distribution across facilities, location performance, and a drill-down plant-and-area hierarchy.
Health report trends
12-month lines for total reports, average health score, and critical assets — with period-over-period deltas.
Every update is tracked and auditable
Re-score an asset, attach the sensor data behind the score, and escalate to a task — all on a versioned, auditable report.

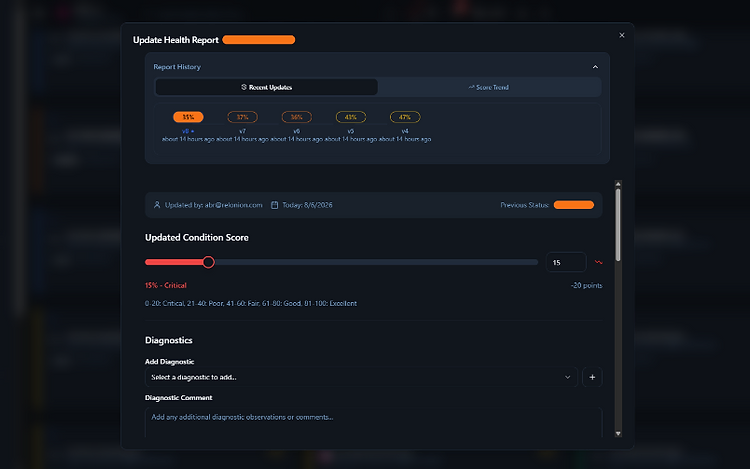
Update health report
Re-score an asset on the Critical→Excellent scale, log the update, and add diagnostics and comments. Every update keeps who changed what and when — a full audit trail per report.

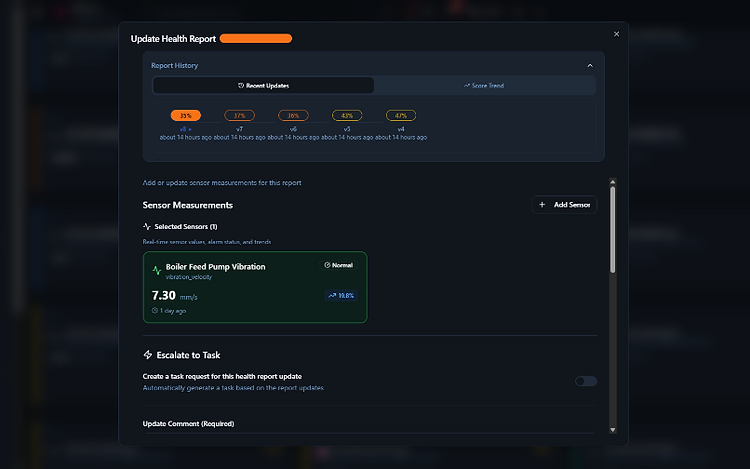
Sensor measurements
Attach live sensor readings to the report — value, alarm status, and trend — so the health score is grounded in the same data the technicians see.

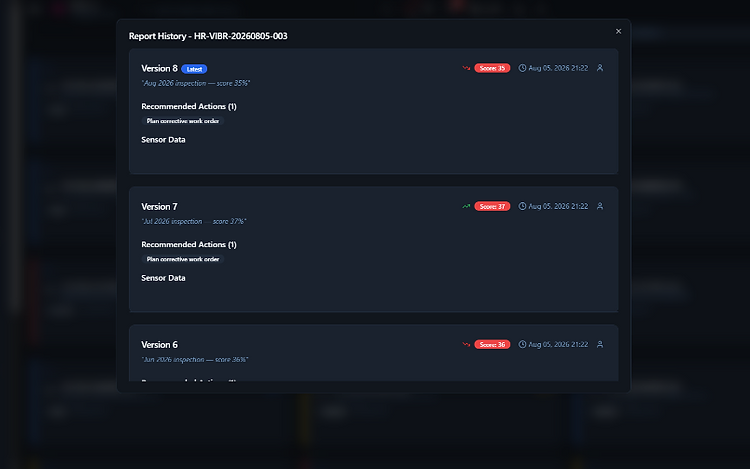
Report history & audit trail
Step through every version of a report: scores, timestamps, recommended actions, generated work orders, and the sensor data behind each update.
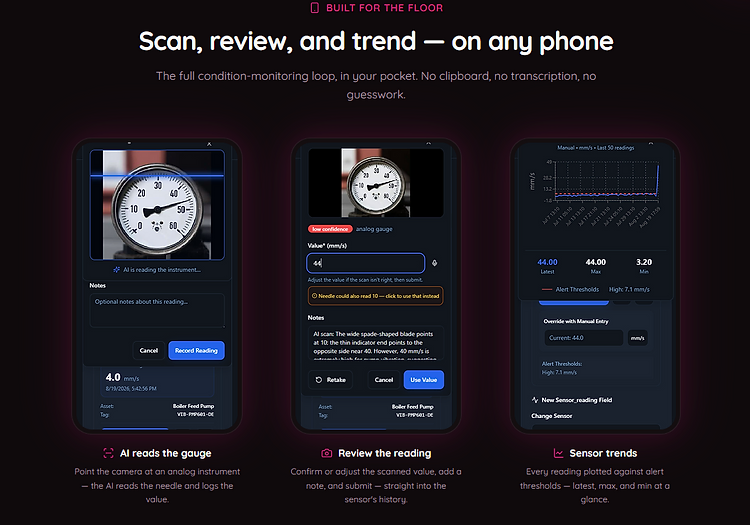
Scan, review, and trend — on any phone
The full condition-monitoring loop, in your pocket. No clipboard, no transcription, no guesswork.

Deep-dive into every sensor signal
Multi-axis trends, statistical summaries, chart-type switching, trend notes — and escalation from any data point.
Multi-axis sensor trends
Line, bar, area, pie, donut, radar, and interactive charts on any combination of sensors. 24h / 7d / 30d windows or custom date range.
Statistical summary
Mean, min, max, std dev, median, range, variance, and data quality shown per sensor — expandable for each channel.
Trend notes
Pin a note to any point on the trend chart — tag it as Investigation, Maintenance, or Observation — and optionally escalate straight to a task request.

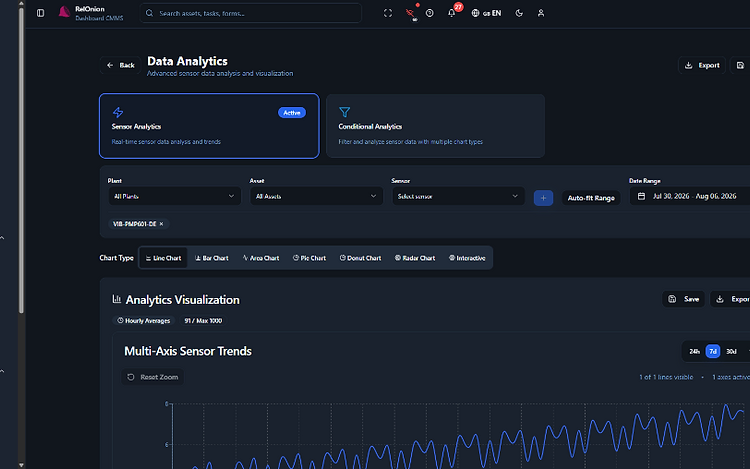
Sensor & conditional analytics
Switch between Sensor Analytics (real-time trends) and Conditional Analytics (filter by multiple chart types). Filter by plant, asset, sensor, and date range.

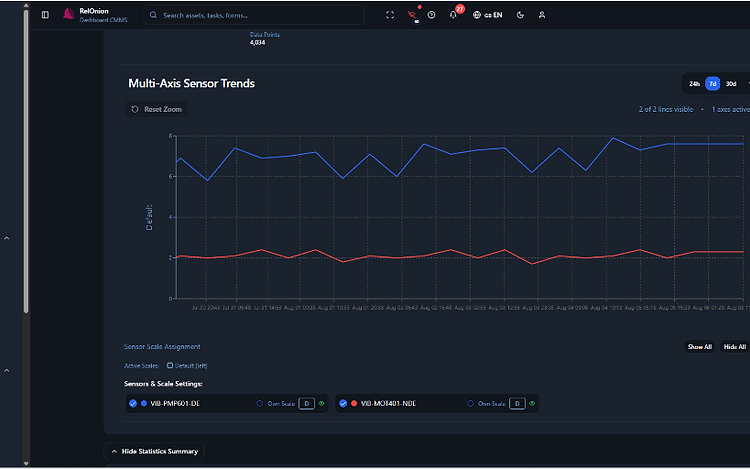
Multi-axis trends
Plot multiple sensors on independent Y-axes with scale assignment, show/hide controls, and data-point count displayed live.

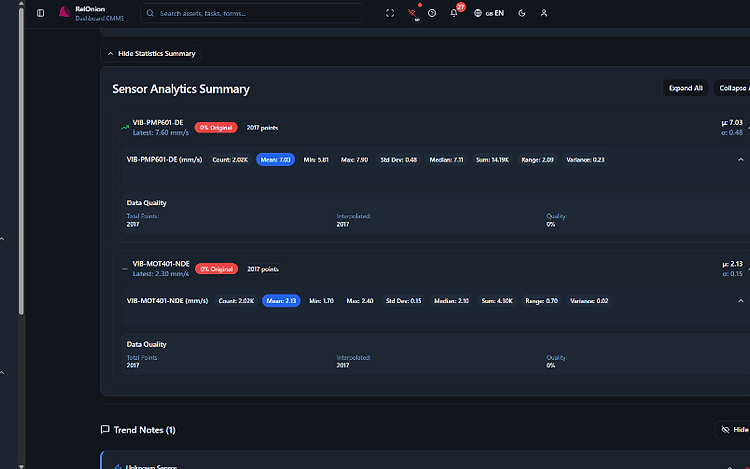
Statistics summary
Expand the summary panel for mean, min, max, std dev, median, range, variance, and data-quality totals — per sensor, per window.

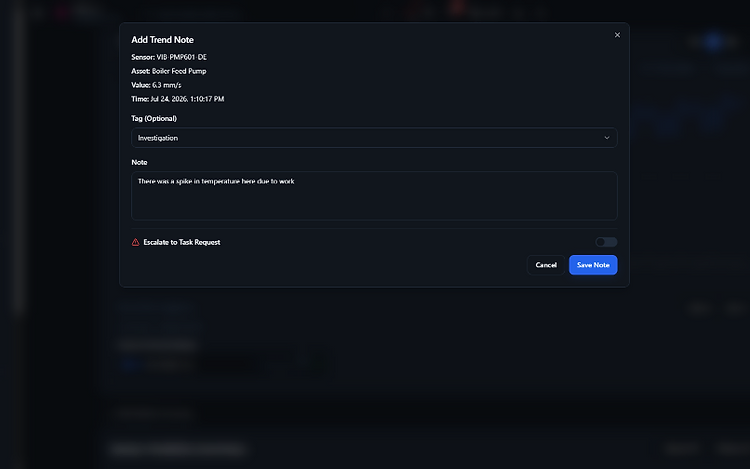
Trend notes & escalation
Click any data point to add a note with tag and free text. Toggle 'Escalate to Task Request' to raise a work order from the trend context itself.
Six alarm types, one unified portal
ISO 10816 vibration, condition score, AI anomaly detection, multi-level threshold, rate-of-change, dead bands and duration filters — all configured in one place and linked to automatic work-order creation.
ISO 10816 vibration alarms
Select machine class (I–IV) and customise the A/B/C/D zone thresholds per sensor to ISO standards.
Condition score alarms
Trigger on asset health score bands — Critical, Poor, Fair, Good, Excellent — directly from the reporting system.
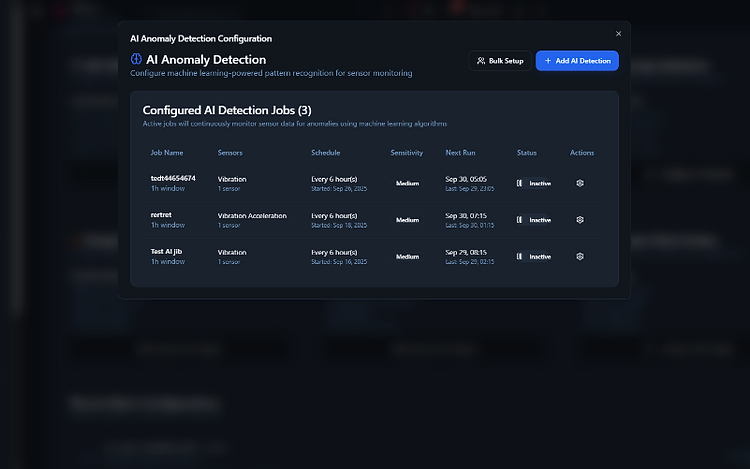
AI anomaly detection
Schedule ML jobs per sensor with configurable sensitivity and time window. Runs every 6 hours by default; creates alarms automatically.
Simple & multi-level thresholds
Standard 4-level, simple 2-level, range monitor, or temperature-monitor quick-setup templates — or build your own.
Rate-of-change alarms
Detect rapid shifts with percentage or absolute change threshold, configurable time window, and minimum readings required.
Dead bands & duration filters
Suppress false alarms during maintenance with dead-band value ranges and duration filters (time-based or sample-based).

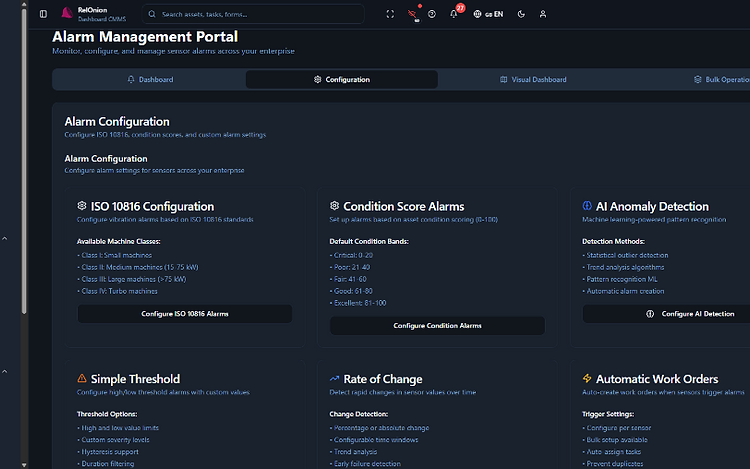
Alarm Management Portal
Dashboard, Configuration, Visual Dashboard, and Bulk Operations — one portal for all alarm types across your enterprise.

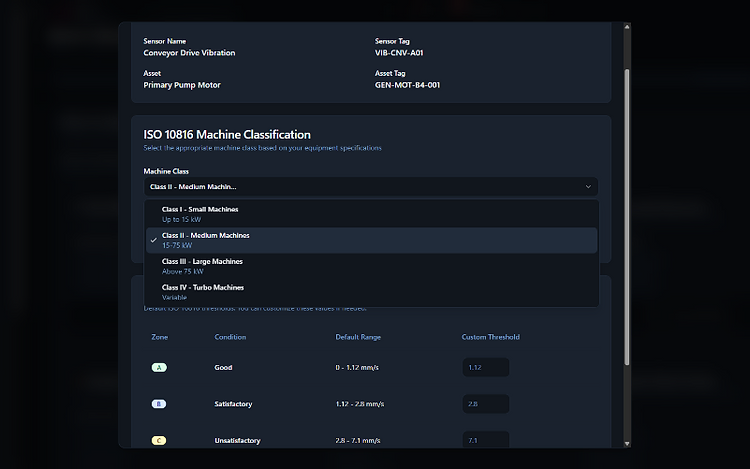
ISO 10816 machine classification
Pick Class I–IV, view default zone ranges, and set custom thresholds per zone. Used automatically for vibration sensors.

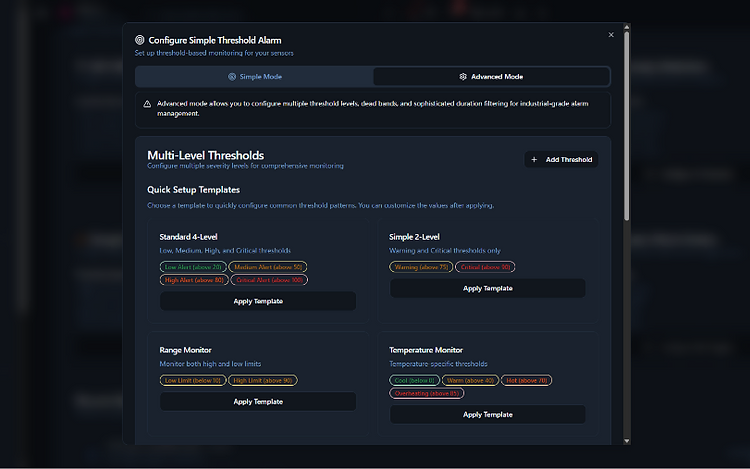
Multi-level threshold templates
Apply quick-setup templates (Standard 4-Level, Simple 2-Level, Range Monitor, Temperature Monitor) and customise values after.

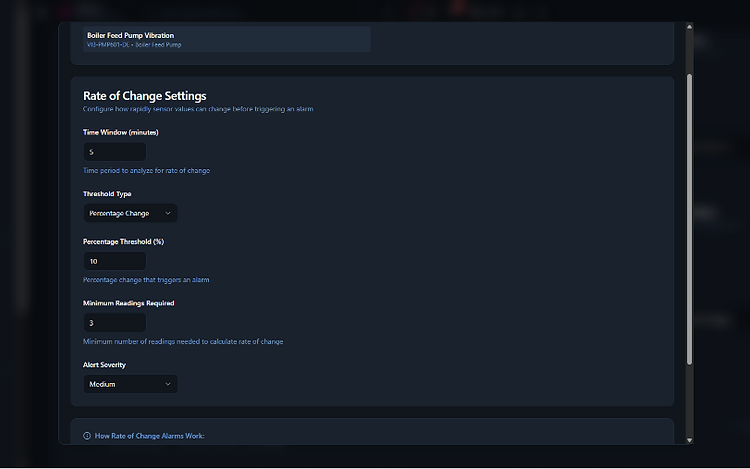
Rate-of-change settings
Time window, threshold type (percentage or absolute), percentage threshold, minimum readings required, and alert severity — per sensor.

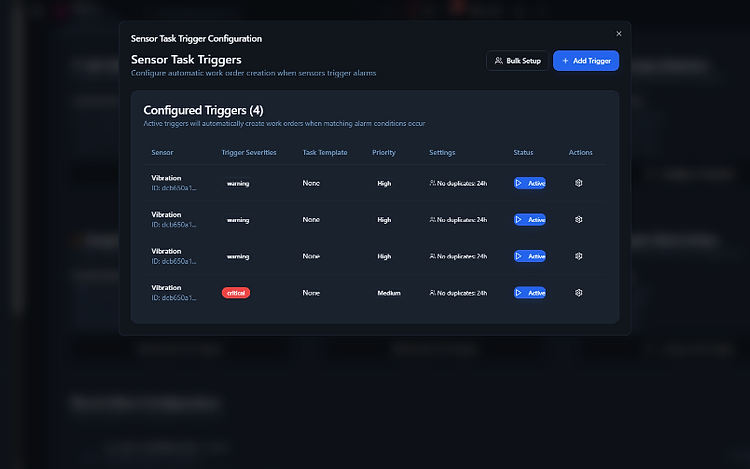
Sensor task triggers
Configure automatic work-order creation when alarms fire — per sensor, per severity, with priority, delay, duplicate-prevention, and task templates.

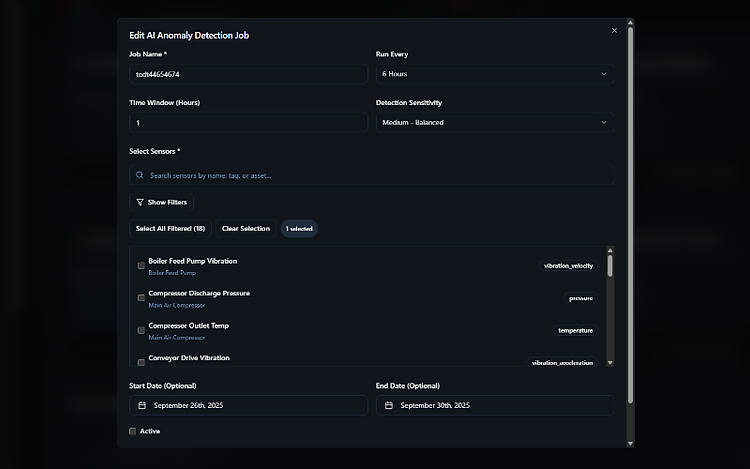
AI anomaly detection jobs
Scheduled ML jobs per sensor with sensitivity, run schedule, and next-run timestamp. Bulk setup available.
See every alarm — act in one click
Cards, list, tree, and a world-map visual dashboard. Acknowledge, pause, or escalate any alarm to a fully pre-filled work order.

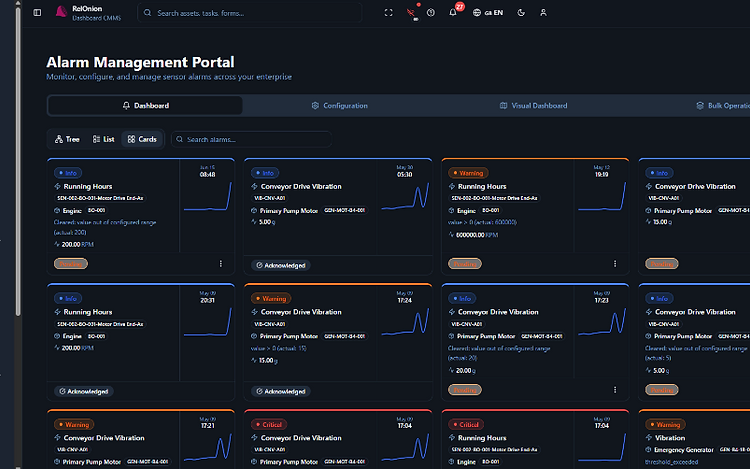
Alarm cards view
Cards show sensor, asset, trigger value, trend sparkline, severity badge, and acknowledge/escalate actions — colour-coded by severity.

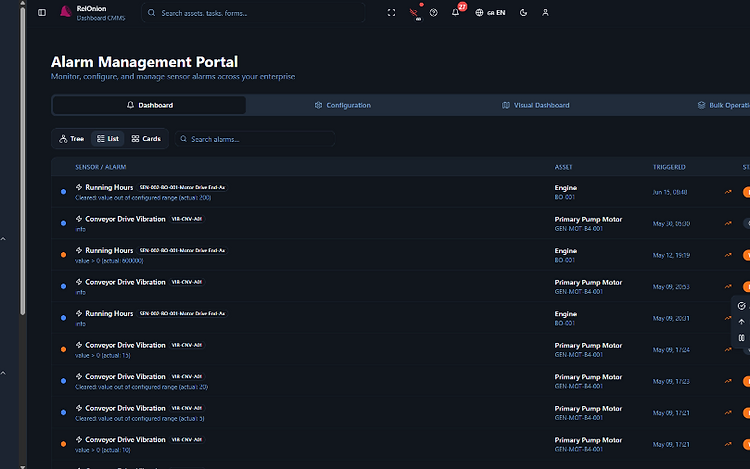
Alarm list view
Tree / List / Cards switch. List view shows sensor, asset, trigger time, status, with inline Acknowledge, Escalate to Task, and Pause Notifications.

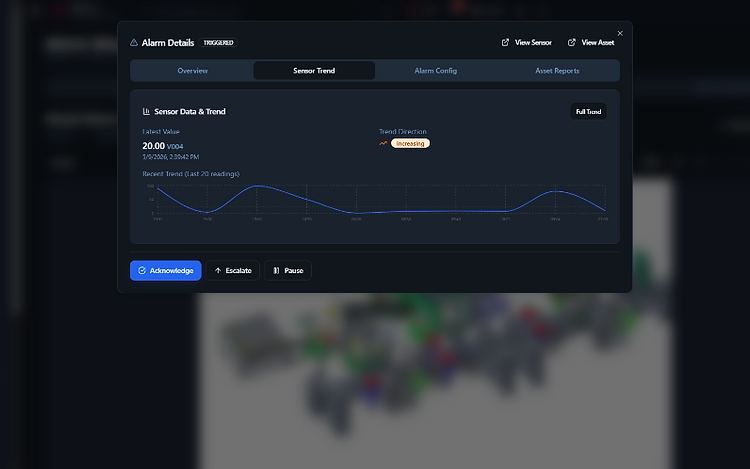
Alarm detail — sensor trend
Drill into any alarm: overview, sensor trend (latest value, trend direction, last 20 readings), alarm config, and linked asset reports.

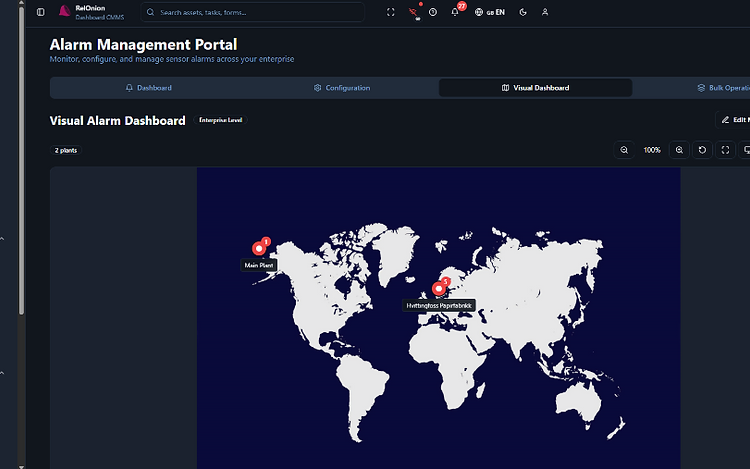
Visual alarm dashboard — world map
Enterprise-level plant map pins show active alarm counts per facility. Click to drill down into a plant schematic.

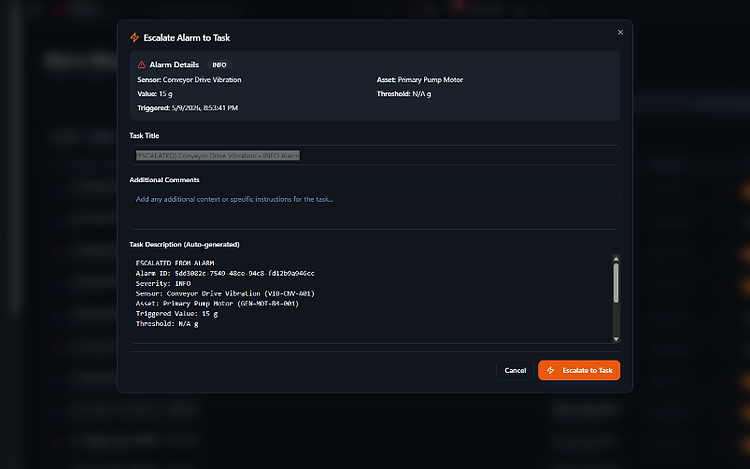
Escalate alarm to task
One-click escalation pre-populates a task with alarm ID, severity, sensor, asset, triggered value, threshold, and condition — ready to assign.
Every sensor, every asset
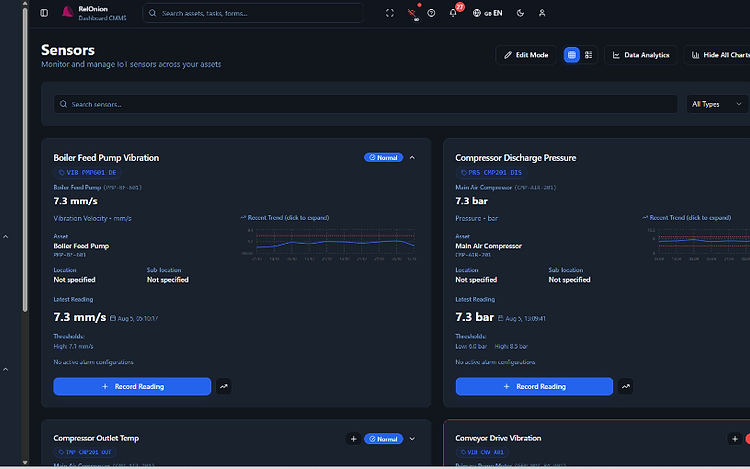
Live values, thresholds, recent trend sparklines, and a full-trend modal — all in the sensor overview.

Sensors overview
Every IoT sensor at a glance — current value, status badge, asset link, location, threshold config, and recent trend sparkline. Record a reading or jump to full trend.

Sensor trend modal
Expand any sensor into its full trend chart — latest, max, and min values shown with date-range data.
AI that reads your condition data
Morning briefings summarize overnight changes. Risk cards rank the assets most likely to bite you. Escalate any card into a work order with full sensor context attached.

See your assets' health in real time.
Connect your sensors and turn condition data into decisions — and decisions into work.
Book a Demo